Integration with Splunk
How to achieve basic integration between Diffusion™ and the Splunk™ analysis and monitoring application
About
Splunk is a third-party application from Splunk, Inc., which provides monitoring and analysis of other applications, primarily by parsing their logs and extracting information of interest. The information is displayed through a web interface, which allows the creation of dashboards and alerts on user-defined events. Splunk is available for all major operating systems.
The Diffusion log format is designed to be consistent and to allow for easy parsing by monitoring tools, not limited to Splunk .
Installation
Installation typically takes just a few minutes, see the appropriate section of the Splunk Installation Manual. For simplicity, we assume that Diffusion and Splunk are installed on the same machine.
Basic configuration
This is easier to do with existing log files to import, so configure Diffusion to write log files. To better demonstrate Splunk , set the server log file to TRACE logging in etc/Logs.xml and start Diffusion .
<!-- Example server log configuration -->
<log name="server">
	<log-directory>../logs</log-directory>
	<file-pattern>%s.log</file-pattern>
	<level>TRACE</level>
	<xml-format>false</xml-format>
	<file-limit>0</file-limit>
	<file-append>false</file-append>
	<file-count>1</file-count>
	<rotate-daily>false</rotate-daily>
</log>
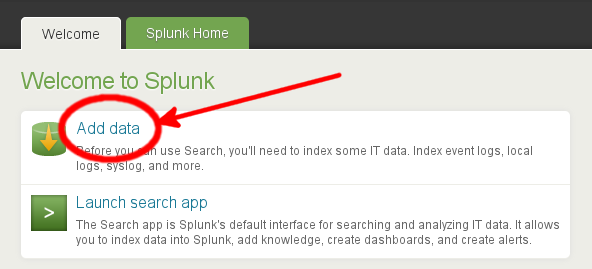
On startup, access the Splunk web UI at http://localhost:8000. After logging in (and changing the default admin password), choose the Add data option.
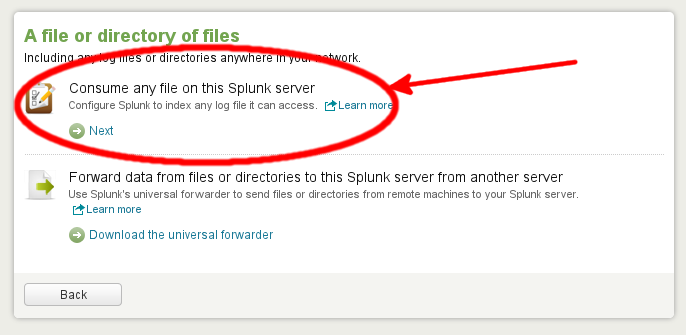
In the Add Data to Splunk screen that follows, choose the link A file or directory of files followed by Consume any file on this Splunk server.
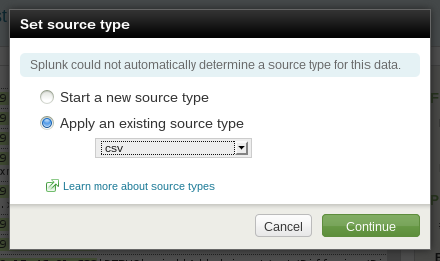
Splunk might not be able to immediately identify the format of the log files; if this is the case, a dialog box similar to the following is presented. Select csv from the existing source types. Diffusion uses a pipe symbol rather than a comma as a separator but this is acceptable to the Splunk CSV parser.
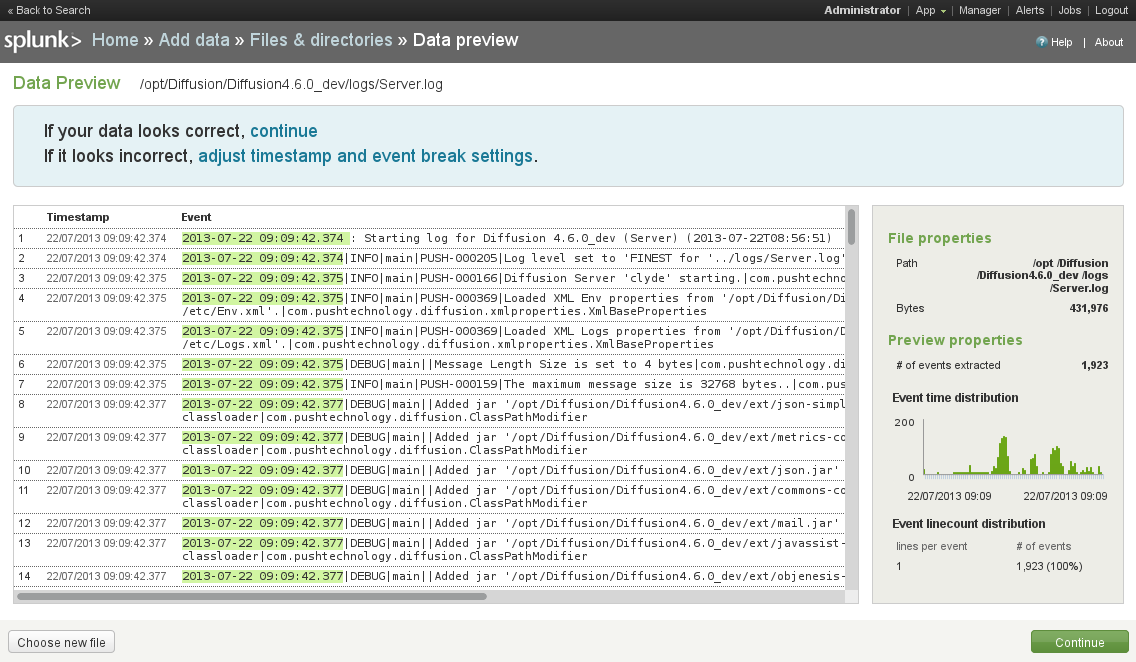
The next dialog allows you to select the Diffusion logs/Server.log file under the Preview data before indexing option, which Splunk reads and parses. On the Data Preview screen, there are numbered log entries with the timestamp highlighted. This indicates that the log file has been correctly parsed. Accept this, and on the next screen, set the source to be continuously indexing the data. You can leave the parameters in More settings at their default values. Once this is done, you have given the new data source a name (for example, Diffusion Server Log) and finally accepted the settings, you can begin searching and generating reports based on the log contents.
Simple searches
Now we have a data source configured, we can start to execute basic searches.
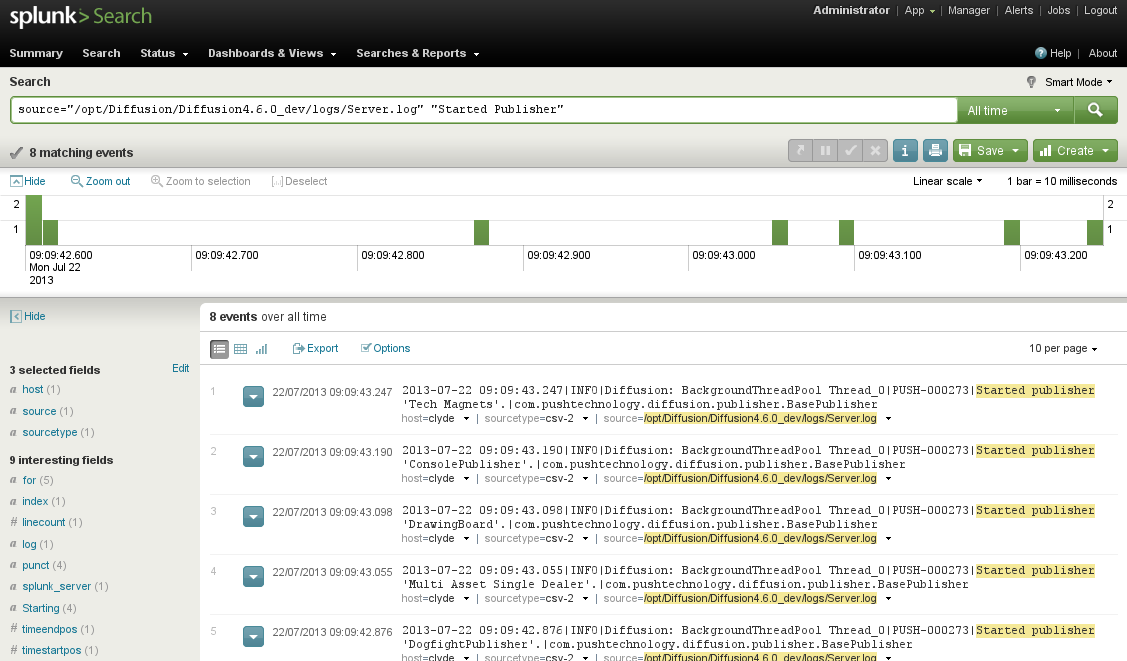
On the Splunk launch page, select the Search option. On the Search Summary page that opens, select the Source relating to the file logs/Server.log previously imported. The page changes to include the source in the Search area. Additional search terms can be added to the end, for example, "Started Publisher".
